Control Plane UI
DRL includes a built-in Control Plane UI: a single-page web dashboard that gives you a live view of the entire cluster — blocked entities, rate-limit metrics, node health, and configuration — served directly from the DRL binary with no external dependencies.
URL
The UI is served on the private API port (8082 by default):
http://<node-address>:8082/v1/ui/Every DRL node exposes its own instance of the dashboard. Once open, the SPA automatically queries peer nodes via the built-in proxy and aggregates their metrics, so you get a cluster-wide view regardless of which node you connect to.
Authentication and encryption
Access to the UI follows a high-security, two-step flow: the bootstrap token is never embedded in the HTML. An operator must retrieve it out-of-band using Digest authentication and paste it into the token modal that appears on first load.
Retrieving the access token
Before opening the UI, obtain the bootstrap token using curl with Digest credentials:
curl --digest -u "admin:$DRL_PRIVATE_API_KEY" http://localhost:8082/v1/ui/get-tokenThe response is a JSON object:
{"bootstrap_token": "<short-lived-token>"}The token is valid for 10 minutes and can only be used once (for the ECDH key exchange). Retrieve a fresh one each time you open the dashboard.
How it works
sequenceDiagram
    participant O  as Operator (curl)
    participant B  as Browser (SPA)
    participant S  as DRL node

    O->>S: GET /v1/ui/get-token (Digest auth)
    S-->>O: {"bootstrap_token": "..."}
    note over O: Copy token to clipboard

    B->>S: GET /v1/ui/ → HTML with <meta name="drl-bootstrap"> (no token)
    note over B: Token modal appears — user pastes token
    B->>B: Generate ephemeral ECDH P-256 key pair
    B->>S: POST /v1/ui/exchange {clientPublicKey, bootstrapToken}
    S->>S: Validate bootstrap token (HMAC-SHA256, 10 min TTL)
    S->>S: Derive shared secret via ECDH
    S->>S: Create session; encrypt session token with AES-256-GCM
    S-->>B: {serverPublicKey, iv, encryptedSession}
    B->>B: Derive same shared secret via ECDH
    B->>B: Decrypt session token with AES-256-GCM
    note over B: Session established — token held in memory only
    B->>S: GET /v1/ui/api/metrics (Authorization: DRL-Session <token>)
    S-->>B: JSON metrics snapshot
Step by step
Token retrieval — the operator calls
GET /v1/ui/get-tokenwith HTTP Digest credentials. The server generates a short-lived bootstrap token (HMAC-SHA256, 10-minute TTL) and returns it as JSON. The token is never embedded in the HTML, so it cannot be intercepted by passive network observers or cached by proxies.Token modal — when the browser opens the UI, a non-dismissible modal prompts the operator to paste the token retrieved in step 1.
ECDH key exchange — the SPA generates an ephemeral ECDH P-256 key pair in the browser via the Web Crypto API. It posts the public key along with the bootstrap token to
POST /v1/ui/exchange.Shared secret derivation — both sides independently derive the same 256-bit shared secret using Diffie-Hellman. Neither side ever transmits the secret itself.
Session token delivery — the server creates a signed session token and encrypts it with AES-256-GCM using the shared secret before sending it back. Only the browser, which holds the private key, can derive the decryption key.
Authenticated requests — the SPA decrypts the session token and uses it as
Authorization: DRL-Session <token>on all subsequent API calls. The token is held in JavaScript memory only — it is never written tolocalStorageor cookies, so it disappears when the tab is closed, requiring a fresh token on the next visit.Cross-node validation — because all DRL nodes share the same API key, they derive the same HMAC signing key. A session token issued by any node is cryptographically valid on all peers, which is what makes the proxy feature work.
Dual-auth for CLI access
The same API endpoints also accept HTTP Digest authentication (SHA-256), so curl and automated
scripts continue to work without changes alongside browser sessions.
Cross-node metrics aggregation
The UI connects to a single node but shows aggregated metrics across the whole cluster.
When the SPA loads the cluster status it receives the list of peer API addresses. It then issues parallel requests through the built-in proxy:
GET /v1/ui/proxy/<peer-host:port>/v1/ui/api/metricsThe receiving node forwards the request to the target peer, attaching the caller’s session token. Because session tokens are cluster-wide (see cross-node validation above), the peer accepts the request and returns its local metrics. The SPA sums all values before rendering charts and KPI cards, and labels every widget with “all nodes” to make aggregation explicit.
Accessing the UI with Docker Compose
The Docker Compose deployment does not publish the private API port (8082) to the host by default.
Use socat to forward it:
docker run --rm -p 8082:8082 \
  --network $(docker network ls -qf "name=docker-compose_drl-network") \
  alpine/socat \
  TCP-LISTEN:8082,fork TCP:docker-compose-drl-1:8082
This creates a tunnel from localhost:8082 into the DRL cluster network and forwards to the first
DRL replica (docker-compose-drl-1). Then open:
http://localhost:8082/v1/ui/The dashboard will automatically discover and aggregate metrics from all other replicas in the cluster via the proxy mechanism — you get a full cluster view even though you are connected to a single node.
Tip — you can tunnel to any replica, not just the first one. All nodes expose the full UI and proxy to their peers. Replace
docker-compose-drl-1withdocker-compose-drl-2etc. to connect to a different node.
Generating traffic to visualise
The Docker Compose stack publishes Envoy’s ingress port (10000) on the host. You can send
requests directly from your browser or with curl to watch the rate-limiter in action:
http://localhost:10000/anythingReload repeatedly (or use a tool like k6 or hey) to ramp up traffic and watch the Blocked
Entities counter climb and the rate-limit charts update in the dashboard.
Dashboard sections
| Section | Description |
|---|---|
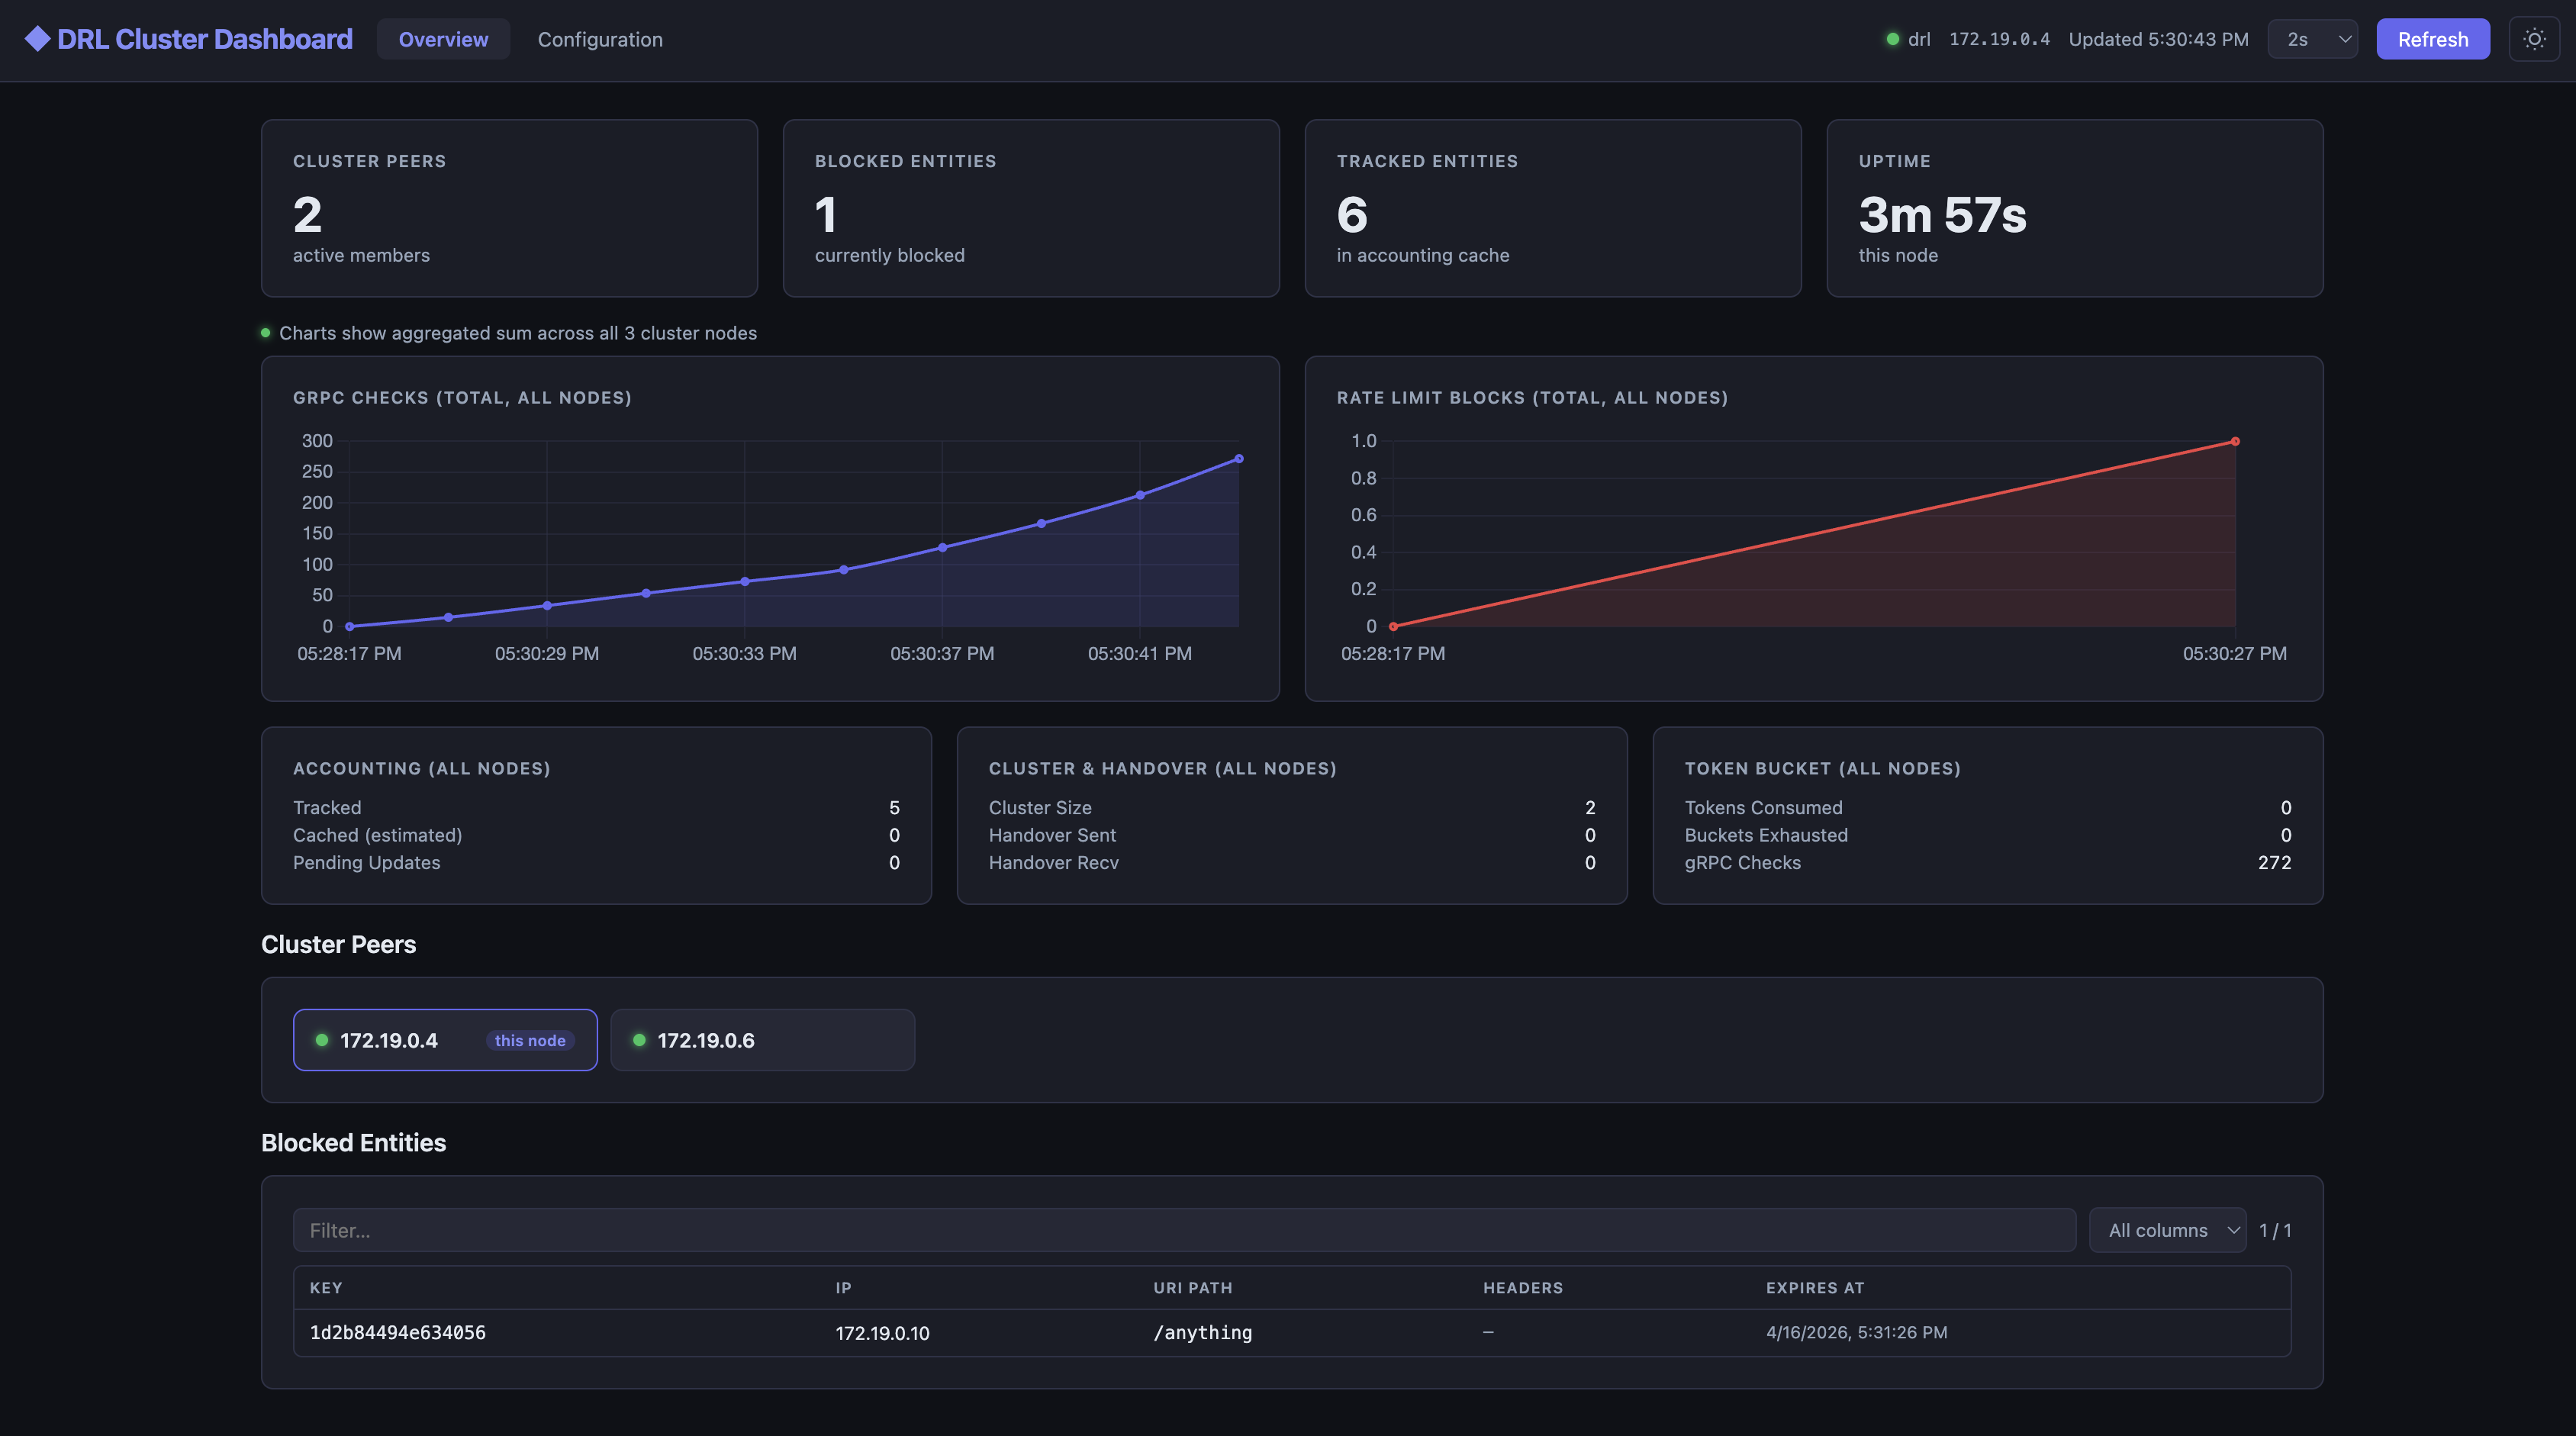
| Cluster Overview | KPI cards (peers, blocked entities, tracked entities, uptime), real-time line charts for gRPC checks and rate-limit blocks, sorted peer list with per-node status indicators, and a searchable/filterable blocked-entities table. All numeric widgets show the sum across all cluster nodes. |
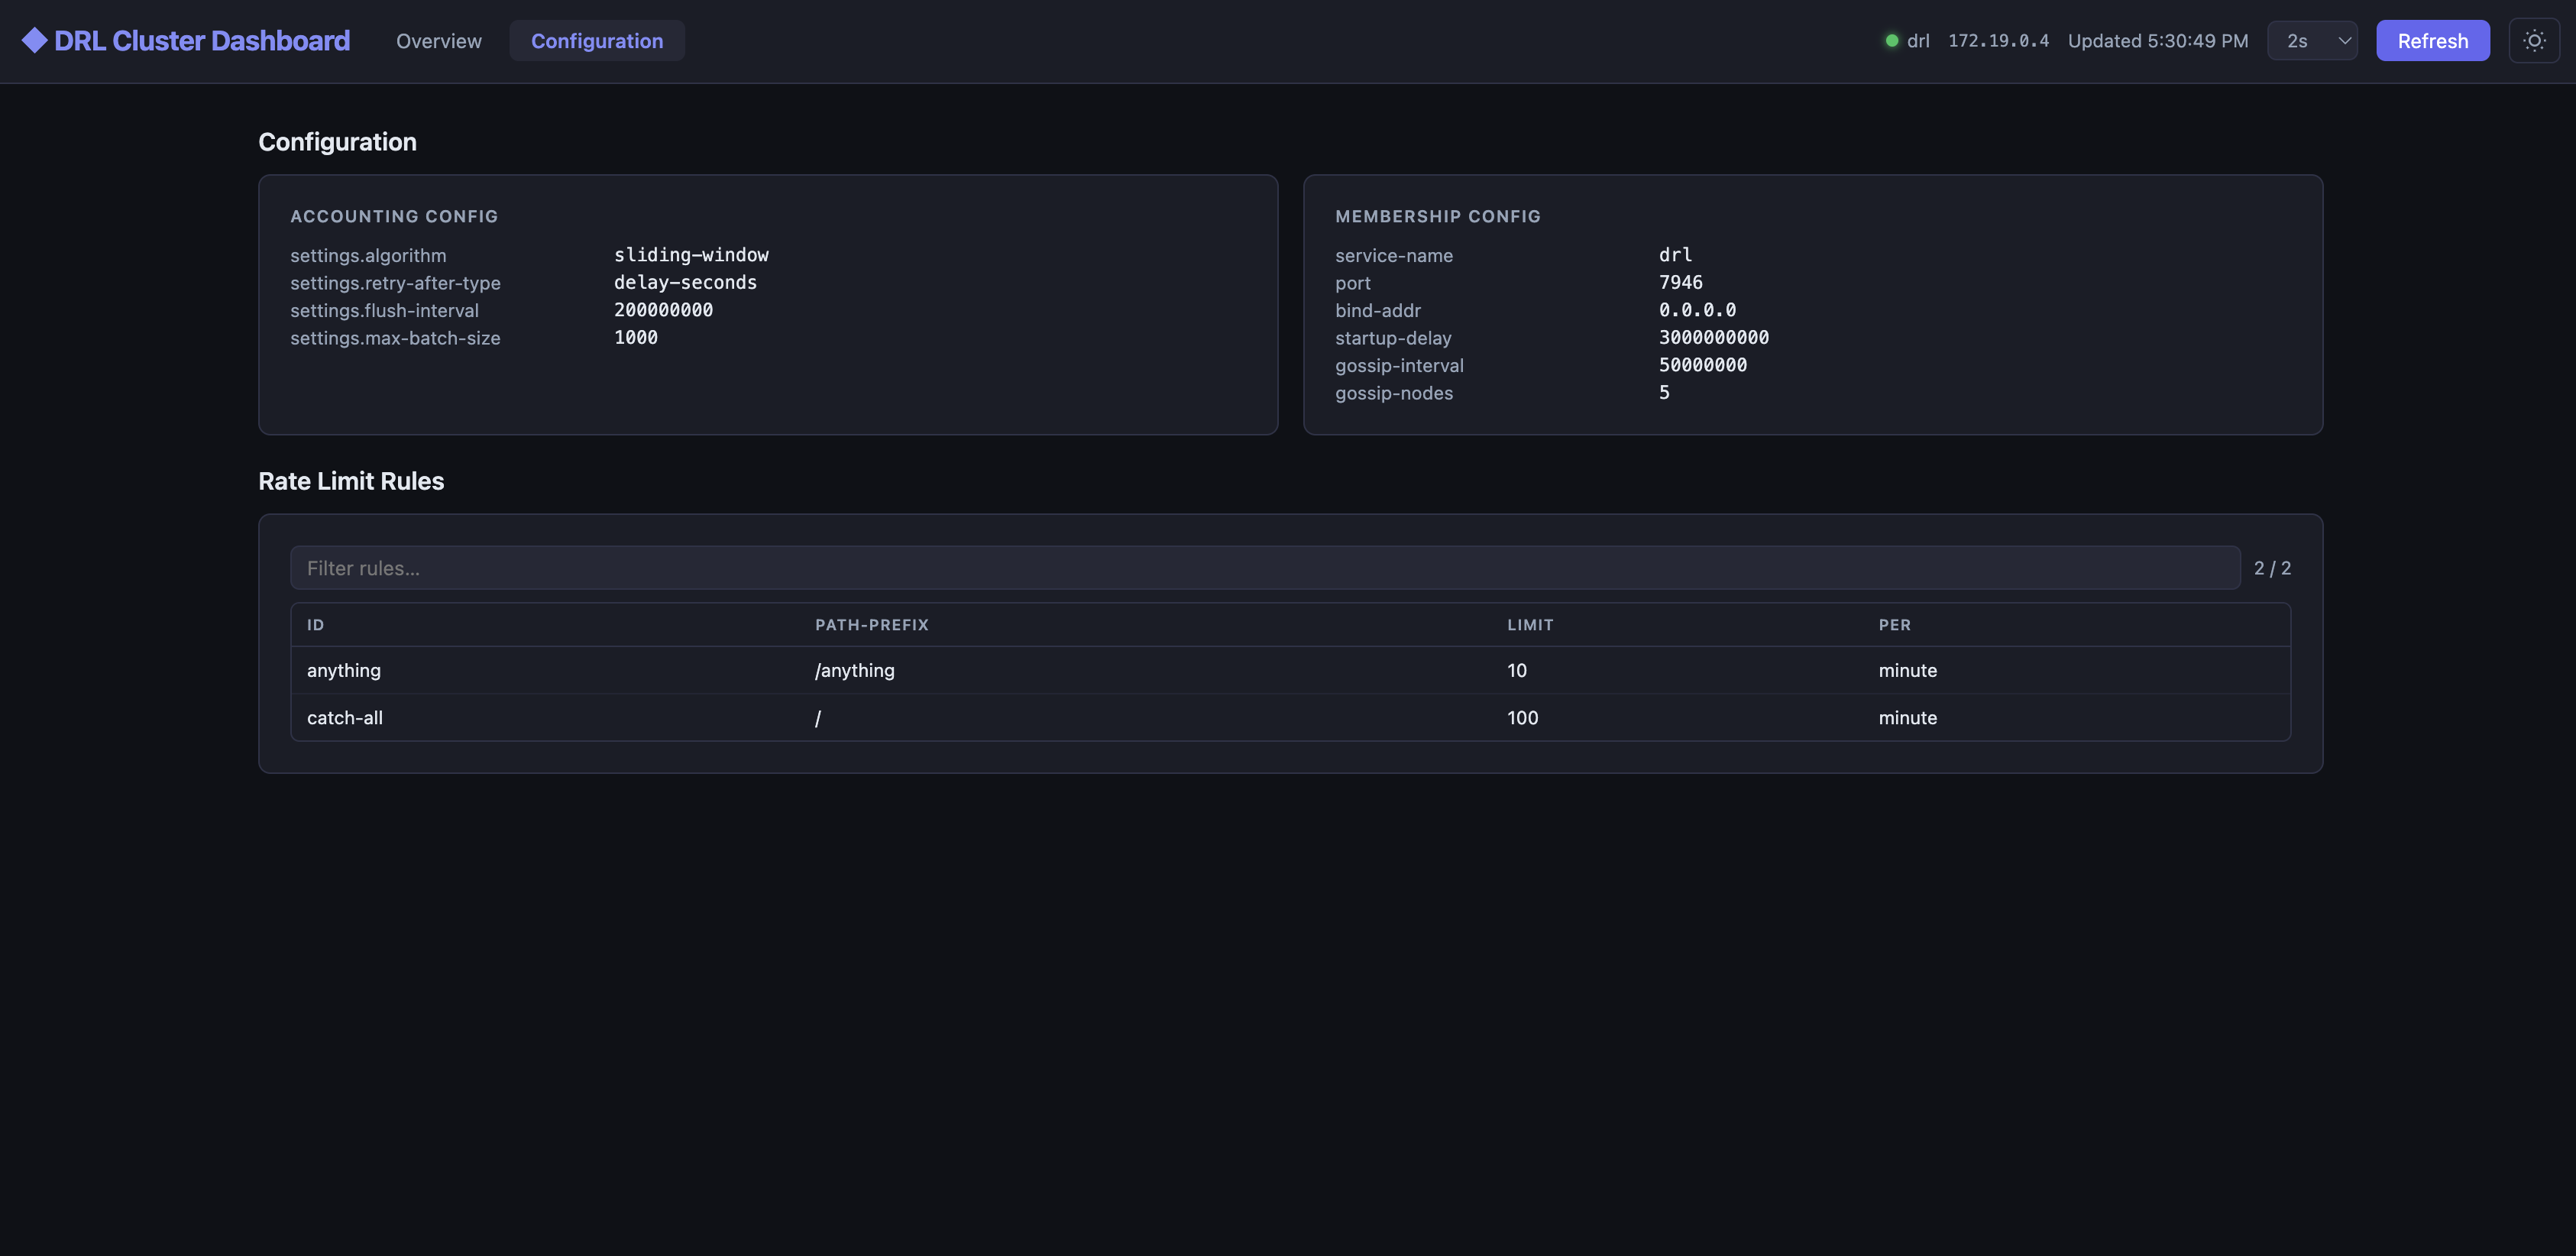
| Configuration | Key-value view of the active accounting and membership configuration, followed by a flat, filterable table of every configured rate-limit rule. |
Auto-refresh
The dashboard refreshes automatically. The default interval is 30 seconds; the header toolbar offers a selector to switch to 1, 2, 5, 10, or 15 seconds for more responsive monitoring during active incidents.
Light / dark mode
A theme toggle in the header switches between dark (default) and light mode. The preference is
persisted in localStorage.